lines plotted as triangles #12
Description
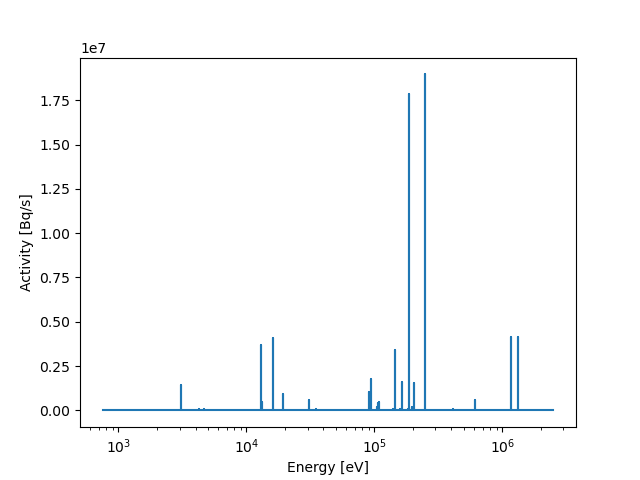
Thanks for making such a nice package, I'm having a go at using it to plot gamma spectra.
I'm currently getting strange triangles appearing in the plot when the default matplot lib shows a simple vertical line.
Does anyone know how to get rid of the triangles visible on the Co60 label on the right hand side and make the lineid_plot look more like the mpl native plot
I've tried adding zeros to the data preceding and after each data point to bring the values back to the axis. This worked for native mpl but now when using lineid_plot
lineid_plot

matplotlib.plot